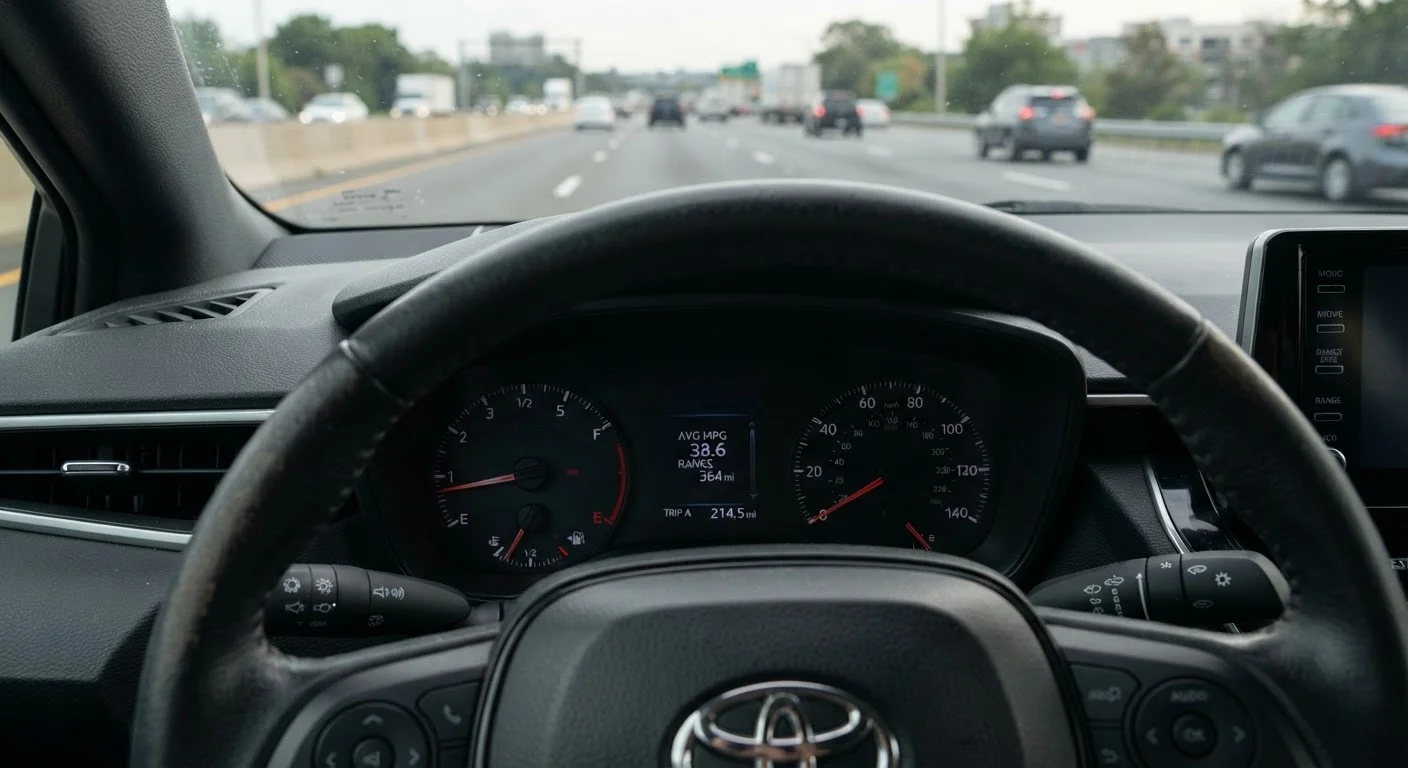
How Official Fuel Economy Ratings Are Actually Generated
When you see an MPG figure printed on a window sticker or listed on a spec sheet, that number comes from a standardized testing procedure administered by the U.S. Environmental Protection Agency (EPA). Manufacturers run their vehicles on a dynamometer - essentially a stationary treadmill for cars - inside a climate-controlled facility. The test simulates a set driving cycle: specific speeds, acceleration rates, and braking patterns that attempt to represent typical American driving.
There are two primary cycles - one representing city driving (lower speeds, more stops) and one representing highway driving (steadier, higher speeds) - and a combined figure averaging both. A third test accounting for higher highway speeds and aggressive acceleration was added later to address consistent gaps between lab results and real-world outcomes.
The fundamental issue is that no standardized cycle can fully replicate the enormous variation in how, where, and in what conditions people actually drive. This is not a flaw in the system - it is an inherent limitation of any standardized benchmark. Understanding that limitation is what equips you to use the numbers wisely. For a broader look at which figures on a spec sheet deserve your attention, see our guide on performance specs.
Common Myths About Fuel Economy Ratings
Spec-sheet MPG figures carry a lot of baggage - buyers often misread what they mean and make purchasing decisions based on assumptions that don't hold up. The myth-and-fact pairs below address the most persistent misconceptions.
Myth
The MPG on the window sticker is what I'll actually get in my daily driving.
Fact
Official ratings are a standardized benchmark, not a real-world prediction. Most drivers see figures 5-20% below the rated number.
EPA test cycles use fixed speed patterns and controlled conditions that don't include air conditioning loads, cold starts, mountain grades, or the kind of variable acceleration most drivers use instinctively. The window sticker is best understood as a comparison tool, not a fuel-bill calculator. When comparing two vehicles, the rated figures reliably indicate which is relatively more efficient - but neither figure will match your personal driving result exactly.
Myth
A higher combined MPG rating always means lower fuel costs over time.
Fact
Fuel cost depends on how you actually drive - a vehicle with a better combined rating may cost more to fuel if its city figure is weak and you rarely use the highway.
The combined figure is a weighted average (55% city, 45% highway under EPA methodology). If your commute is predominantly urban stop-and-go, a vehicle with a strong city rating and weaker highway number will serve your wallet better than one with a high combined average driven by an exceptional highway figure. Always isolate the figure that matches your primary driving pattern when comparing vehicles. See what fuel economy figures leave out for a deeper look at this gap.
Myth
Newer vehicles always achieve their rated fuel economy more consistently than older ones.
Fact
Model year alone doesn't determine real-world accuracy. Testing methodology improvements help, but driving behavior and conditions remain the dominant variables.
The EPA has updated its test protocols over the years - adding a high-speed test and an air-conditioning test - specifically because early cycles consistently over-predicted real-world economy. These updates have reduced the average gap between rated and real-world figures. However, research consistently shows that individual driving style, speed habits, and climate account for far more variation than the vehicle's model year. A driver who accelerates aggressively and frequently exceeds posted speed limits will underperform the rating in any vehicle, new or old.
Myth
Hybrids always deliver better fuel economy than conventional engines, regardless of how you drive.
Fact
Hybrid systems are optimized for low-speed, stop-and-go conditions. On sustained highway runs, their advantage over efficient conventional engines can shrink substantially.
The efficiency gain in a hybrid comes largely from regenerative braking - recovering energy that would otherwise be lost as heat when slowing down. At steady highway speeds, there is little braking and therefore little energy to recover. The combustion engine carries most of the load, and the hybrid system's overhead (battery weight, dual drivetrain components) can reduce the net advantage. Buyers who primarily drive long highway stretches should compare highway-specific figures carefully rather than assuming the hybrid label guarantees lower fuel costs. The Performance and Drivetrain hub covers powertrain trade-offs in more depth.
Real-World Variables That Move the Needle
Even when two drivers own identical vehicles, their real-world fuel economy can differ by 20% or more. Several factors consistently account for that gap:
- Speed: Aerodynamic drag increases exponentially with speed. Driving at 75 mph instead of 65 mph can reduce highway fuel economy by roughly 10-15%.
- Temperature: Cold engines run richer fuel mixtures until they warm up, and cabin heating draws additional energy. EPA data indicates fuel economy can drop noticeably in temperatures below 20°F.
- Cargo and passengers: Additional weight forces the drivetrain to work harder, especially on grades and during acceleration.
- Terrain: Repeated hill climbing dramatically increases fuel consumption compared to flat-road lab conditions.
- Accessories: Air conditioning can reduce fuel economy by up to 25% under heavy use, a factor not fully reflected in base test cycles.
If you drive a truck or SUV, these variables carry even more weight. Trucks in particular show wide divergence between rated and real-world economy when load, towing, and terrain enter the picture.
~20%
Typical real-world MPG shortfall vs. EPA rating
EPA data and independent analyses consistently show many drivers experience fuel economy 10-20% below the official rated figure under everyday conditions.
Up to 25%
Fuel economy reduction from heavy A/C use
According to U.S. Department of Energy estimates, running air conditioning at maximum capacity can reduce fuel economy by up to 25% in some vehicles.
How to Use Fuel Economy Data When Comparing Vehicles
Rather than treating MPG figures as a reliable budget calculator, use them as a comparative index. If Vehicle A is rated 10% more efficient than Vehicle B under the same EPA methodology, that relative gap is likely to persist in real-world conditions - even if both actual figures land lower than advertised.
To build a more accurate picture before buying:
- Check third-party aggregators: Sites that crowdsource real owner fuel economy data across thousands of drivers provide a more grounded average than lab tests alone.
- Match the test to your commute: If you drive mostly city miles, weight the city MPG figure more heavily in your comparison. Highway commuters should do the reverse.
- Account for your climate: Buyers in colder northern states should expect more consistent deviation from rated figures than those in moderate climates.
- Consider powertrain type carefully: Hybrids deliver their greatest efficiency advantage in stop-and-go urban traffic. On sustained highway runs, that advantage narrows considerably. Understand why hybrid figures drop on the highway before assuming one fits your route.
Fuel economy is just one input in the total cost of ownership equation. Pair it with insurance costs, maintenance schedules, and depreciation trends for a complete picture. For related context on how engine specs can mislead buyers, see engine performance myths that trip up car buyers.
This article provides general educational information about how fuel economy ratings work. It is not a guarantee of any specific vehicle's performance or fuel costs. Consult official EPA resources and speak with a qualified automotive adviser for guidance tailored to your situation.