How EPA Fuel Economy Testing Works for Trucks
The U.S. Environmental Protection Agency's fuel economy ratings are produced using standardized laboratory drive cycles - simulated routes run on a dynamometer, not an actual road. For trucks, the agency uses the same five test cycles applied to passenger cars: city, highway, high speed, air conditioning load, and cold temperature. Each cycle is designed to represent a slice of typical American driving, but none of them involve a trailer, a loaded bed, or significant grade changes.
The resulting numbers represent a controlled baseline. They are useful for comparing one truck model against another under identical conditions, but they are not promises about what you will see at the pump. For a broader look at how this gap forms across all vehicle types, see why spec-sheet fuel figures rarely match real life.
Trucks introduce specific variables that amplify the gap between the label and the driveway: their large frontal areas create significant aerodynamic drag at speed, their mass magnifies the fuel cost of acceleration, and their purpose - carrying and pulling loads - routinely pushes the powertrain into ranges the test cycles never explore.
Common Misconceptions - and What the Data Actually Shows
Truck buyers frequently arrive with assumptions about fuel economy that the EPA label unintentionally reinforces. The myth-fact pairs below address the most consequential of those misconceptions.
Myth
The EPA highway rating is what I'll get on a road trip with my truck.
Fact
Highway estimates assume steady speeds around 60 mph with no load. Sustained interstate driving at 75+ mph with a trailer or loaded bed typically yields noticeably lower figures.
The EPA highway cycle averages roughly 48 mph and peaks around 60 mph - well below typical U.S. interstate speeds. Aerodynamic drag grows exponentially with speed, so a truck cruising at 75 mph faces substantially more resistance than the test assumes. Add a trailer or a loaded bed and the gap widens further. Independent real-world tests consistently show full-size pickups returning 10-20% fewer miles per gallon during highway road trips than their EPA highway ratings suggest.
Myth
A truck rated at 20 mpg combined will get 20 mpg whether or not I'm towing.
Fact
The EPA combined rating is calculated without any trailer or payload. Active towing can reduce fuel economy by 20-35% compared to the unladen figure.
No EPA test cycle involves a trailer. When a truck pulls a significant load, the engine operates at higher throttle positions for longer periods, the transmission downshifts more frequently, and aerodynamic drag increases sharply due to the trailer's profile. A truck rated at 20 mpg combined might return 13-16 mpg while towing a midsize travel trailer - a gap large enough to meaningfully change the cost of ownership over time.
Myth
Choosing a diesel engine guarantees better real-world fuel economy than gasoline.
Fact
Diesel trucks often lead on unladen highway mpg, but the advantage narrows or disappears in city driving, during heavy towing, or when diesel fuel prices are elevated.
Diesel powertrains produce more torque at lower rpm, which benefits highway cruising and sustained towing efficiency. However, diesel engines are heavier, which increases city fuel consumption, and diesel fuel typically costs more per gallon than regular gasoline. The total cost calculation - fuel savings versus higher purchase price, diesel cost premiums, and more expensive maintenance - depends heavily on how and where the truck is used. High-mileage, highway-dominant users with consistent towing needs tend to benefit most; low-mileage or city-heavy users often do not recover the price difference.
Myth
Newer trucks with cylinder deactivation or mild-hybrid systems always hit their EPA estimates in daily use.
Fact
These technologies improve efficiency primarily under light-load, steady-speed conditions - exactly the scenarios EPA tests favor. Under demanding real-world conditions, their benefit shrinks.
Cylinder deactivation systems - which shut down half the engine's cylinders during light cruising - work best at steady highway speeds with minimal accessory load. Aggressive acceleration, towing, extreme temperatures, or frequent speed changes all trigger full-cylinder operation, reducing or eliminating the fuel savings. Mild-hybrid assist systems similarly recover energy during deceleration but provide limited benefit when the truck is under sustained load. These are meaningful engineering advances, but they do not eliminate the gap between the EPA label and real-world truck use.
Understanding these distinctions matters beyond simple budgeting. If you are choosing between a mid-size and a full-size pickup partly on fuel economy grounds, real-world data from owner communities and independent testers often reveals a narrower gap than the labels suggest - particularly when both trucks are used for work. See how mid-size and full-size pickups compare on practical fuel economy for a detailed breakdown.
Variables That Move the Needle Most
Several factors consistently produce the largest deviations from the EPA sticker in real-world truck ownership:
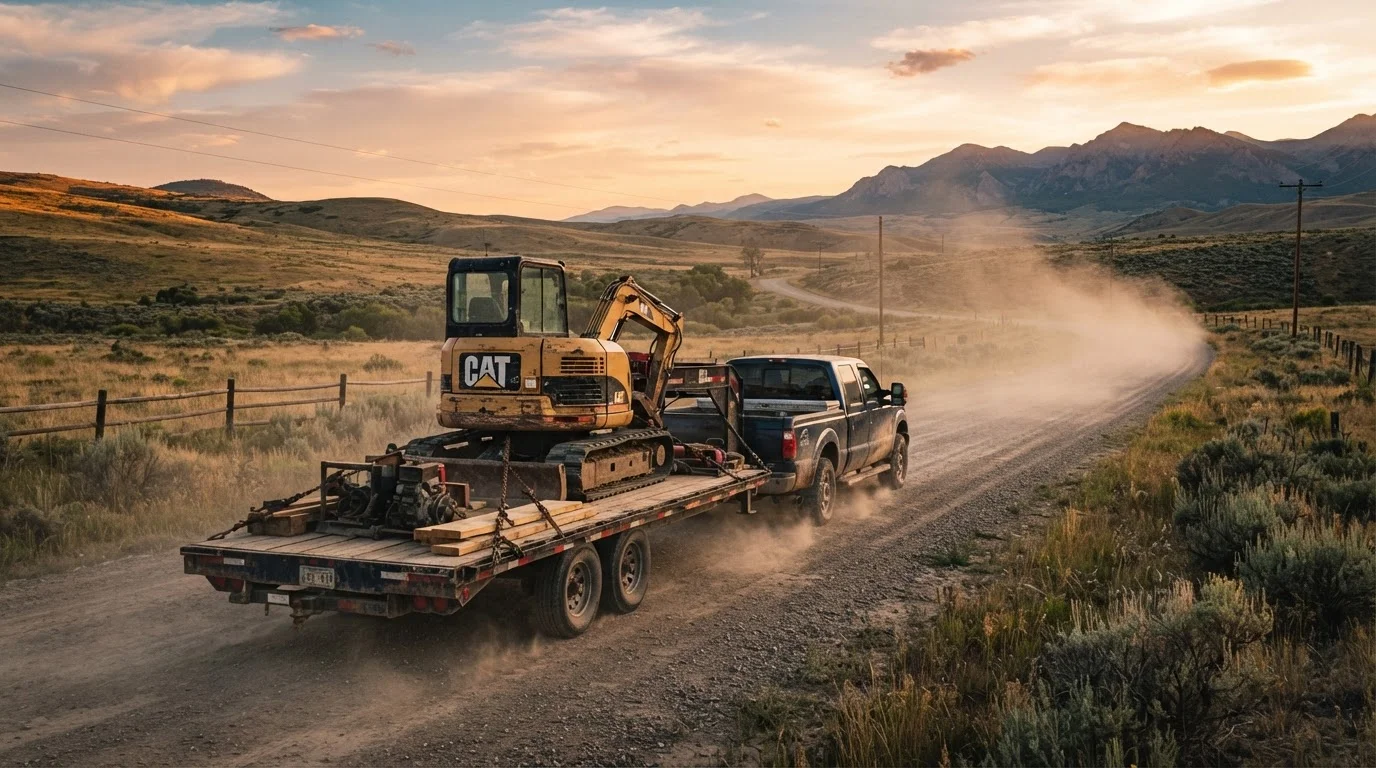
- Towing: Pulling a trailer dramatically increases aerodynamic drag and powertrain load. Fuel economy drops of 20-35% during active towing are commonly reported by owners and independent testers. The heavier the trailer relative to the truck's rated capacity, the steeper the penalty. For context on how towing ratings are established - and why confusing them with payload ratings can lead to costly errors - see the difference between payload and towing capacity.
- Payload: A fully loaded bed raises rolling resistance and shifts the truck's weight distribution, requiring more engine effort, especially on grades.
- Speed: Aerodynamic drag increases with the square of velocity. Driving at 75-80 mph - common on U.S. interstates - significantly worsens efficiency compared to the EPA's 60 mph highway cycle.
- Drivetrain: Four-wheel-drive systems add mechanical friction even in 2H mode on some trucks. Heavier cab configurations (crew cab vs. regular cab) also add curb weight and frontal area.
- Terrain and climate: Hilly or mountainous routes, cold temperatures, and frequent stop-and-go conditions each reduce efficiency in ways the standard test cycles only partially capture.
Shoppers who want a realistic fuel cost estimate should look at owner-reported data from sources like the EPA's own fueleconomy.gov user database, which aggregates real-world fill-up records, rather than relying solely on the window sticker figure.