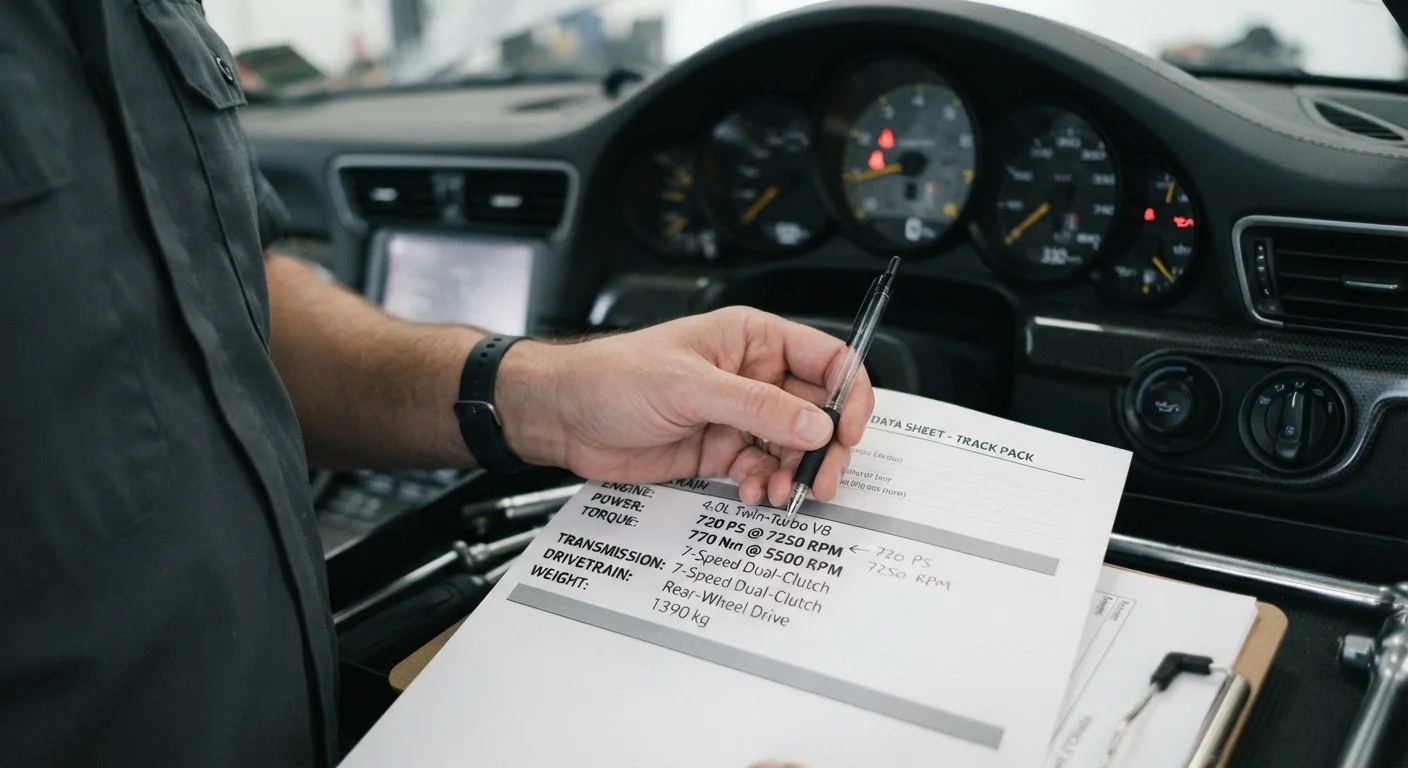
Why Spec Sheets Can Mislead as Easily as They Inform
A vehicle's spec sheet is packed with numbers, but not all of them reflect what you'll actually experience during daily commutes, highway merges, or weekend drives. Manufacturers have an incentive to feature the figures that look impressive — sometimes at the expense of the ones that tell the most honest story about ownership.
Understanding which metrics deserve your attention — and which are mostly marketing shorthand — puts you in a much stronger position when comparing vehicles or trim levels. Our guide to reading a performance spec sheet covers the full landscape of powertrain figures; this article zeroes in on what to weigh closely and what to mostly set aside.
Test Drive Before Trusting the Sheet
Spec sheets describe a vehicle's capabilities under defined test conditions, not necessarily how it feels to you in ordinary use. Whenever possible, test drive a vehicle in conditions that resemble your typical driving — stop-and-go traffic, a freeway merge, a loaded cargo run — before forming a final opinion. Numbers set expectations; real-world drives confirm or revise them.
The Specs That Actually Shape the Driving Experience
Torque — especially where it arrives in the rev range
Torque is the rotational force that actually accelerates the car from a standstill or during passing. Peak torque is worth noting, but where in the rev range it arrives matters just as much. An engine that produces its maximum torque at 1,500 rpm will feel effortlessly responsive in city traffic; one that needs 5,000 rpm to reach peak torque requires much more driver effort to access that same energy.
Turbocharged engines typically deliver strong low-rpm torque, which is one reason they feel punchy in everyday driving even with smaller displacements. Naturally aspirated engines often build torque more gradually. Our article on turbo versus naturally aspirated ownership differences explores how this trade-off plays out over years of ownership.
Where torque arrives in the rev range shapes everyday driving feel more than peak figures alone.
Power-to-weight ratio
Raw horsepower without the context of the vehicle's mass is only half the story. A 300-hp compact and a 300-hp large SUV deliver very different experiences because the SUV may weigh 1,000 pounds more. Dividing horsepower by curb weight (in pounds) gives you a ratio that's far more predictive of real acceleration feel and agility.
When comparing vehicles in the same segment, power-to-weight ratio is one of the most honest performance metrics available. How kerb weight and power-to-weight ratio translate to driving impressions breaks this down further for sedans and hatchbacks.
Dividing horsepower by curb weight reveals more about real-world performance than either figure alone.
Transmission type and number of gears
The transmission determines how efficiently the engine's power reaches the wheels across a range of speeds. An 8- or 10-speed automatic can keep the engine operating in its most efficient range, improving both performance and fuel economy. A continuously variable transmission (CVT) eliminates fixed gear steps entirely, which suits efficiency-focused driving but draws criticism for its driving feel under hard acceleration.
The number of gears matters less than how well a transmission is tuned to the engine it's paired with. A smoothly calibrated 6-speed can feel more satisfying than a poorly mapped 9-speed. If a CVT is part of your consideration, separating CVT reputation from reality offers a balanced assessment of where the technology genuinely stands today.
Transmission tuning quality matters more than the number of gears listed on a spec sheet.
0–60 mph time — useful, but context-dependent
Zero-to-60 times are widely cited but frequently misunderstood. The figure is measured under controlled conditions — often with a professional driver, launch control engaged, and optimal surface temperature — that few buyers will ever replicate. It's a useful relative benchmark when comparing vehicles in the same segment, but it won't tell you how a car responds during a freeway on-ramp merge or a routine city acceleration.
Think of 0–60 as a single data point in a larger picture. Our dedicated article on what the 0–60 figure tells you and what it leaves out explains the test conditions behind the number and what it genuinely reveals.
Zero-to-60 is a relative benchmark, not a promise about how the car accelerates on your commute.
Peak horsepower — prioritise less than you might think
Horsepower is the spec most prominently marketed, but for the vast majority of drivers it's one of the least relevant day-to-day figures. Peak horsepower is produced at high engine speeds that most drivers rarely reach in normal use. What you feel at typical driving speeds is more a product of torque, transmission response, and vehicle weight than horsepower alone.
This doesn't mean horsepower is irrelevant — it matters for sustained high-speed driving and towing capacity — but it shouldn't dominate your comparison if your driving is primarily urban or suburban. Focus on how the powertrain performs in the 1,500–4,000 rpm range where most daily driving occurs.
Peak horsepower is produced at high revs most drivers rarely reach during everyday use.
Engine displacement — a declining predictor of performance
A larger engine displacement (measured in liters) once reliably signaled more power and torque. That relationship has weakened significantly as turbocharging became mainstream. A modern 2.0-liter turbocharged four-cylinder can produce more power and torque than a naturally aspirated 3.5-liter V6 from a decade ago, while also returning better fuel economy under normal driving conditions.
Comparing engine sizes across different eras or across turbocharged and naturally aspirated engines is therefore not particularly informative. Displacement remains one factor in predicting reliability patterns and maintenance costs, but as a performance predictor alone, it's largely been overtaken by other metrics.
Engine displacement is a poor performance predictor now that turbocharged engines dominate the market.
Making Smarter Comparisons
When you're narrowing a shortlist, use the specs above as a starting framework rather than a final verdict. A vehicle that looks modest on paper can feel genuinely satisfying to drive if its torque arrives at the right point and its weight is well-managed. Equally, a high headline power figure on a heavy SUV may translate to underwhelming real-world response.
Fuel economy figures deserve particular scepticism. As explained in our article on why fuel economy figures rarely match real life, EPA ratings are produced under controlled laboratory conditions, so treat them as a relative comparison tool between vehicles rather than a precise monthly fuel cost estimate. And when building your shortlist, our step-by-step shortlisting method can help you filter by the factors — including powertrain — that genuinely match your needs.