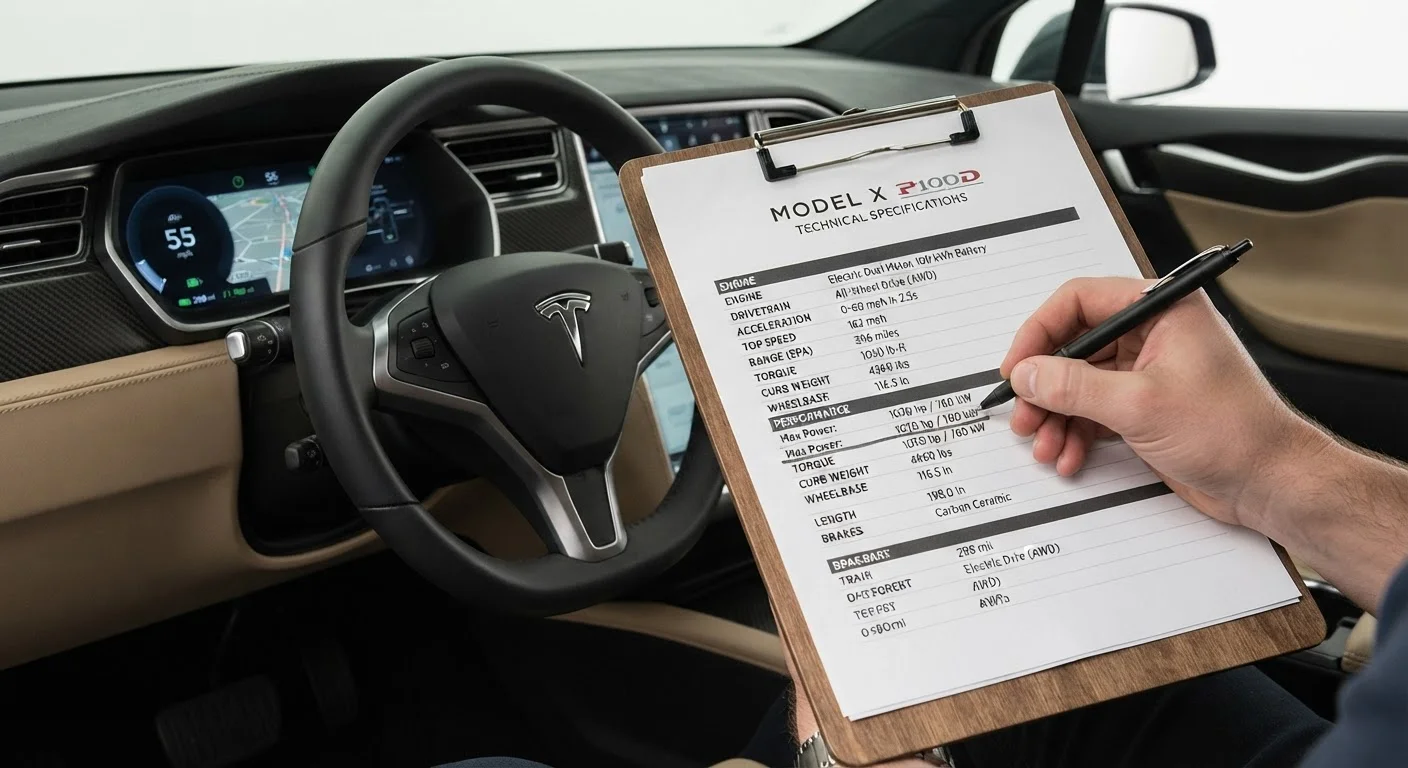
Why Spec Sheets Feel Overwhelming — and How to Change That
A modern car's performance spec sheet can run to dozens of rows: engine displacement, compression ratio, bore and stroke, valve timing, gear ratios, redline, curb weight, and more. For most buyers, the sheer density of figures triggers one of two reactions — either eyes glaze over, or a single headline number (usually horsepower) gets treated as the whole story. Neither approach serves you well at the point of purchase.
The solution is not to memorise every metric but to learn which figures connect directly to the driving experience you are paying for. A well-read spec sheet tells you how a car will feel pulling onto the freeway, how it will behave hauling a full load, and whether it will reward a spirited weekend drive or simply drone along efficiently. The Research & Compare hub is a useful starting point if you are still in the early stages of narrowing down your options.
What you will need
Before working through the steps below, gather the spec sheets for each vehicle you are comparing. If any term stops you cold, the spec sheet glossary covers every figure you are likely to encounter.
Step-by-Step: Decoding the Key Performance Figures
Specs Are Measured Under Ideal Conditions
Every performance figure — horsepower, torque, 0–60 mph — is measured in controlled laboratory or track conditions that rarely match everyday driving. Altitude, temperature, fuel grade, and vehicle load all affect real-world output. Use spec sheet numbers for comparison between vehicles, not as guarantees of what you'll experience behind the wheel.
Locate the official powertrain specifications
Start on the manufacturer's website and navigate to the specific trim level you are considering. Look for a tab or section labelled Specifications or Technical Data. Avoid relying solely on third-party listing sites, which sometimes carry outdated or incomplete figures. The official source will separate engine output by trim and engine option, which matters if a model is offered with multiple powertrains.
Read horsepower and torque together — with their RPM peaks
Horsepower (hp) measures sustained power output and broadly governs top-end speed and highway passing ability. Torque (lb-ft) measures rotational force and determines how strongly a car pulls away from a stop or climbs a grade. Neither figure is useful without knowing the RPM (revolutions per minute) at which it peaks.
- A turbocharged engine producing peak torque at 1,500 RPM delivers strong low-speed pull — useful in city driving and towing.
- A naturally aspirated engine peaking at 6,500 RPM rewards drivers who rev it out but may feel flat in urban traffic.
For a deeper explanation of these terms, the powertrain terminology reference defines every figure you will encounter.
Factor in curb weight and calculate the power-to-weight ratio
Curb weight — the vehicle's mass without passengers or cargo — directly shapes how the engine's output translates into motion. Divide the horsepower figure by the curb weight (in pounds) to get a rough power-to-weight ratio. A higher ratio generally means quicker acceleration and more responsive feel.
Example: a 300 hp vehicle weighing 3,000 lb produces 0.10 hp per lb. The same 300 hp in a 4,500 lb SUV yields only 0.067 hp per lb — a meaningfully different driving character despite identical peak power.
Understand the transmission type and gear ratios
The spec sheet will list the transmission type — such as 6-speed automatic, 8-speed dual-clutch, or CVT (continuously variable transmission) — along with individual gear ratios and a final drive ratio. These numbers affect how the engine's power band reaches the wheels.
- A lower numerical first-gear ratio (e.g., 4.71:1) produces stronger initial acceleration but requires more frequent shifts.
- A taller final drive ratio (e.g., 2.73:1 vs 3.55:1) lowers cruising RPM and typically improves fuel economy at highway speeds.
If this area feels unfamiliar, how drive modes interact with transmission tuning is worth reading alongside the spec sheet.
Assess the 0–60 mph time in context
The 0–60 mph time is the most widely quoted performance figure because it is easy to understand intuitively. However, manufacturers and automotive publications test under conditions — full fuel, optimal temperature, launch control enabled — that may not reflect your daily commute. Treat the figure as a relative benchmark for comparing vehicles in the same class, not as a promise.
A difference of half a second in 0–60 is noticeable in direct back-to-back testing but rarely meaningful in normal traffic. Focus more on mid-range acceleration (30–70 mph) figures when available, as these better reflect highway passing and merging confidence.
Identify which specs matter most for your use case
Once you have the key figures in hand, map them to how you will actually drive the vehicle. A daily city commuter benefits most from low-RPM torque and a smooth, responsive transmission. A highway cruiser gains more from a tall final drive ratio and high-gear horsepower. A weekend driver who values feel may weigh the power-to-weight ratio and redline more heavily.
Our companion piece on which performance specs deserve the most attention helps you cut through the noise. Also watch for the traps outlined in common spec sheet misreads — some figures are presented in ways that can mislead without being technically inaccurate.
Compare Specs in Context, Not in Isolation
A torque figure only becomes meaningful when you know the vehicle's curb weight and the RPM at which that torque arrives. Always read powertrain numbers alongside weight and gearing figures. Our article on kerb weight and power-to-weight ratio explains exactly how these figures combine into a driving impression.
Working through these steps in order ensures you build context before drawing conclusions. Horsepower alone is meaningless without weight; weight is meaningless without torque delivery; torque delivery is shaped by the transmission. Each figure amplifies or limits the others, and understanding those relationships is what separates a confident buyer from one who is easily swayed by a single impressive-sounding number.
For buyers comparing sedans and hatchbacks specifically, the discussion of how kerb weight shapes driving feel translates these abstract ratios into concrete impressions you can anticipate before a test drive.