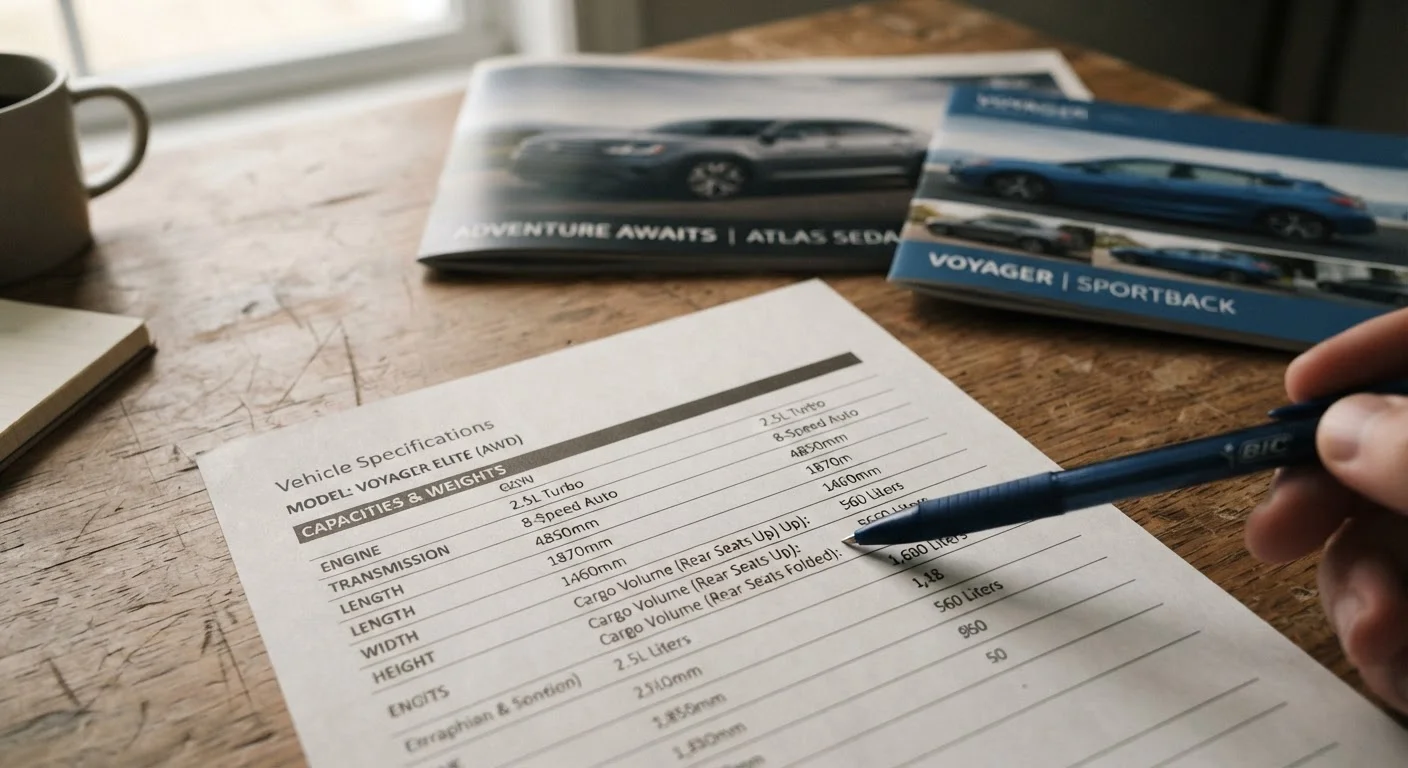
Why Spec Sheets Mislead Even Careful Buyers
Side-by-side spec comparisons feel like a reliable shortcut, but the numbers on a manufacturer's data sheet carry hidden assumptions that aren't always explained. Sedans and hatchbacks measure the same attributes - cargo space, power output, interior dimensions - using methods that differ enough to make raw comparisons misleading. Understanding where those gaps occur is the first step toward reading specs with real confidence.
The article Sedan vs Hatchback: What Actually Separates These Two Body Styles explains the structural differences between these two body styles, which directly shape how their specs are recorded and what those figures mean in practice.
Comparing cargo volume without checking the measurement method used for each body style.
Why it happens: Manufacturers list a single cargo figure, and buyers assume the same measurement standard was applied to every vehicle on the comparison list.
Treating peak horsepower or torque as the sole measure of a vehicle's real-world performance.
Why it happens: Peak output is the most prominently advertised figure because it sounds impressive, so buyers naturally use it as the primary comparison point.
Taking official fuel economy ratings as a reliable prediction of real-world consumption.
Why it happens: The figures appear on the window sticker and in marketing materials, giving them an air of authority that suggests everyday accuracy.
Ignoring trim-level differences when comparing performance or efficiency figures between variants.
Why it happens: Buyers often compare a base model of one nameplate with a loaded variant of another, without noticing the curb weight and equipment differences that affect the numbers.
Assuming rear headroom specs apply equally across seating positions within the same vehicle.
Why it happens: A single rear headroom figure is listed, and buyers interpret it as reflecting the experience of all rear occupants - including those at outboard seats under a sloping roofline.
Cargo Volume, Power, and Dimensions: Where the Numbers Break Down
Three categories generate the most confusion when buyers compare spec sheets across body styles: cargo space, engine output, and interior dimensions. Each has specific measurement conventions worth knowing.
Cargo Volume
Sedan boot volume is typically measured to the lower window line - a fixed, enclosed space. Hatchback cargo volume is often measured to the roofline with rear seats up, which produces a significantly larger-looking number by including space that isn't usable for most loads. For a meaningful comparison, look for the seats-up figure measured to the window sill, or compare both figures against physical load dimensions your household actually carries. The article Hatchback Cargo Versatility: How Folding Rear Seats Change the Equation covers how seat-fold configurations further change real-world capacity.
10-20%
Typical gap between official and real-world fuel economy
Studies from consumer and government testing bodies in the US have consistently found real-world fuel consumption falls 10-20% below EPA-rated figures in mixed driving conditions.
Up to 30%
Cargo volume difference by measurement method
Measuring to the roofline versus the window line on the same hatchback can produce a figure up to 30% larger, without any actual change in usable carrying capacity.
Engine Output
A horsepower or torque figure stated without its accompanying RPM is almost meaningless for assessing everyday driveability. Two vehicles can share an identical peak torque number, but if one delivers it at 1,800 rpm and the other at 4,200 rpm, the low-speed pulling power - relevant for urban merging and hill starts - differs substantially. Always check where in the rev range peak figures occur. The guide Reading a Car's Performance Spec Sheet Without Getting Lost decodes these metrics in plain terms.
Interior Dimensions
Rear headroom figures on sedans with sloping rooflines or panoramic glass panels can be technically accurate yet practically overstated. The measurement is taken at the geometric center of the seat position - not where a taller occupant's head actually sits. If headroom is a priority, verify by sitting in the vehicle during a test drive. See Boot Space, Rear Legroom, and Headroom: Reading a Sedan's Dimensions for a deeper breakdown of which interior measurements are most reliable.
Don't Rely on Spec Sheets Alone for Interior Fit
Published headroom and legroom measurements are single-point geometric figures that may not reflect comfort for taller passengers or those sitting in outboard rear positions under a sloping roofline. A vehicle that lists adequate headroom on paper can still feel cramped for a six-foot passenger in the rear seat. Always confirm interior fit with an in-person seating check before finalising a shortlist.
Fuel economy ratings are another area where spec-sheet figures and real-world results diverge. Official ratings reflect standardised laboratory test cycles that don't replicate highway driving at varying speeds, air-conditioning use, or stop-and-go urban conditions. Treat EPA or equivalent ratings as a comparative benchmark between vehicles, not a prediction of your actual fill-up costs.
Finally, trim-level curb weight variations can shift performance outcomes enough to matter. A base model may weigh noticeably less than a fully loaded variant of the same nameplate - which affects both acceleration and fuel efficiency, even though the engine spec is shared. What the Kerb Weight and Power-to-Weight Ratio Tell You puts those numbers in practical context.
Once you've worked through the spec sheets, take your shortlist to a structured test drive. The Key Questions to Ask During a Sedan or Hatchback Test Drive offers a structured checklist so nothing important gets overlooked in the moment.