Why Depreciation Doesn't Move in a Straight Line
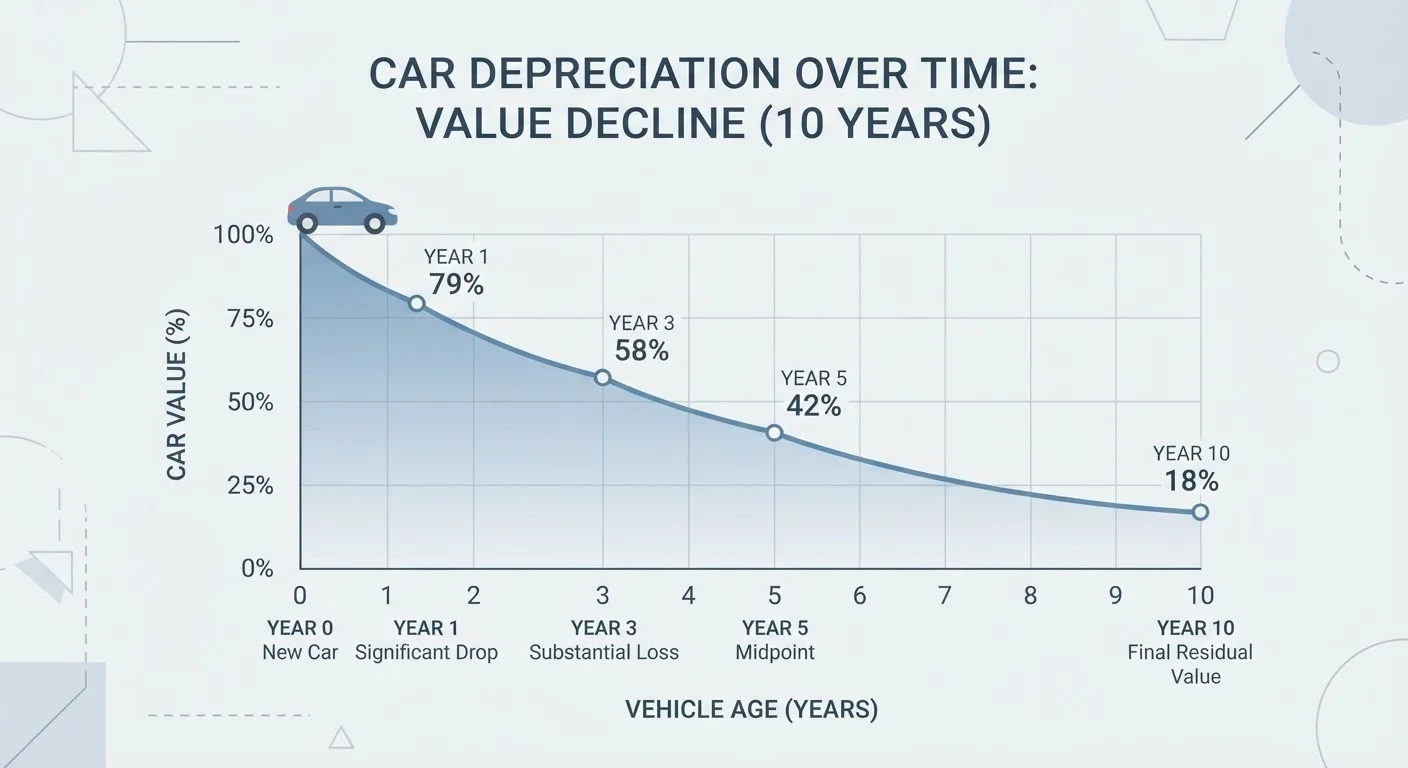
A common misconception among car buyers is that a vehicle loses roughly the same percentage of value each year. In practice, depreciation is front-loaded. The sharpest price drop happens between purchase and the three-year mark, after which the curve flattens and losses slow down considerably.
Several factors drive that early steepness. The moment a new car is registered, it becomes a used car — a status shift the market prices immediately. Manufacturer warranties begin counting down, new model-year vehicles arrive to compete with last year's inventory, and any early-ownership flaws become the current owner's problem to disclose. All of this compresses value quickly in the first one to three years.
After year three, most of those one-time hits have already landed. The vehicle's condition, mileage accumulation, and ongoing market demand take over as the dominant pricing factors. That's a fundamentally different value dynamic — and one buyers can use to their advantage.
15–25%
Typical first-year depreciation rate
Most mainstream vehicles lose roughly 15–25% of their original purchase price within the first twelve months, according to automotive pricing industry estimates.
~50%
Cumulative depreciation by year five
Industry pricing data broadly indicates that many vehicles lose approximately half their original value within five years, though rates vary significantly by segment and model.
Years 2–4
Common "sweet spot" for used car value
Buyers and automotive analysts frequently cite the two-to-four-year age range as the period where the steepest depreciation has passed but usable vehicle life remains substantial.
The Depreciation Curve by Age: What to Expect
Year 1: Typically the single largest drop in percentage terms — commonly 15–25% of the original MSRP. A $40,000 new car can realistically be worth $30,000–$34,000 after twelve months regardless of condition, simply because it is no longer new.
Years 2–3: Significant but decelerating losses. Cumulative depreciation commonly reaches 35–45% of the original purchase price by the end of year three. A well-maintained three-year-old vehicle may still have most of its usable service life ahead of it, having absorbed nearly half its total depreciation already.
Years 4–5: The curve begins to flatten meaningfully. Annual value losses in this window tend to be lower in dollar terms than earlier years, though total accumulated depreciation continues to climb. This is often the range where monthly payment-focused buyers find vehicles that are affordable without being aged.
Years 6–10+: Depreciation slows to a crawl for most vehicles. Price is now driven heavily by mileage, maintenance history, and regional demand rather than age alone. High-mileage examples in this bracket can be very inexpensive, while low-mileage, well-documented vehicles may command a meaningful premium.
For a closer look at how these dynamics play out across vehicle segments, see how depreciation varies between car segments.
Using the Curve to Evaluate Used Car Prices
Knowing where a vehicle sits on the depreciation curve lets you pressure-test any asking price. If a seller is pricing a two-year-old vehicle only marginally below its new sticker price, that's a red flag — the market typically doesn't support it unless the vehicle is in genuinely exceptional condition and demand is unusually high.
Conversely, a vehicle priced well below what depreciation tables would suggest for its age and mileage may carry undisclosed problems. Pricing that looks like a steep discount from expected market value deserves careful scrutiny before you proceed.
Practical steps for applying depreciation data when comparing deals:
- Look up the vehicle's original MSRP from a manufacturer or historical source.
- Apply standard depreciation estimates (widely available through automotive pricing guides) for the vehicle's age and mileage range.
- Compare the result to the seller's asking price — significant deviations in either direction warrant investigation.
- Factor in ownership costs beyond the sticker. Maintenance patterns shift as vehicles age, and insurance premiums adjust too. See how insurance costs differ for new vs. used cars to build a complete budget picture.
For a broader five-year cost comparison, total ownership costs across new and used purchase scenarios puts these figures into a structured framework.
Depreciation and Reliability: The Trade-Off Buyers Need to Understand
Buying further along the depreciation curve generally means a lower purchase price, but it also means buying a vehicle with more wear accumulated. The two aren't automatically in conflict — many vehicles remain highly reliable well past 100,000 miles with appropriate maintenance — but the trade-off is real and worth weighing deliberately.
Vehicles in the four-to-seven-year range often represent the sharpest intersection of value and usability for buyers who are comfortable with some maintenance costs. Vehicles beyond eight to ten years can offer very low purchase prices, but the probability of significant repair costs rises and should be factored into your total cost estimate, not ignored.
Reliability trends across a vehicle's life provides useful context for understanding what to expect mechanically at different ages and mileage bands, which pairs directly with depreciation data when you're comparing vehicles at different price points.
This article provides general educational information about vehicle depreciation and is not a guarantee of any specific vehicle's value or reliability. Consult market pricing guides and, where appropriate, a qualified mechanic or financial professional before making a purchase decision.