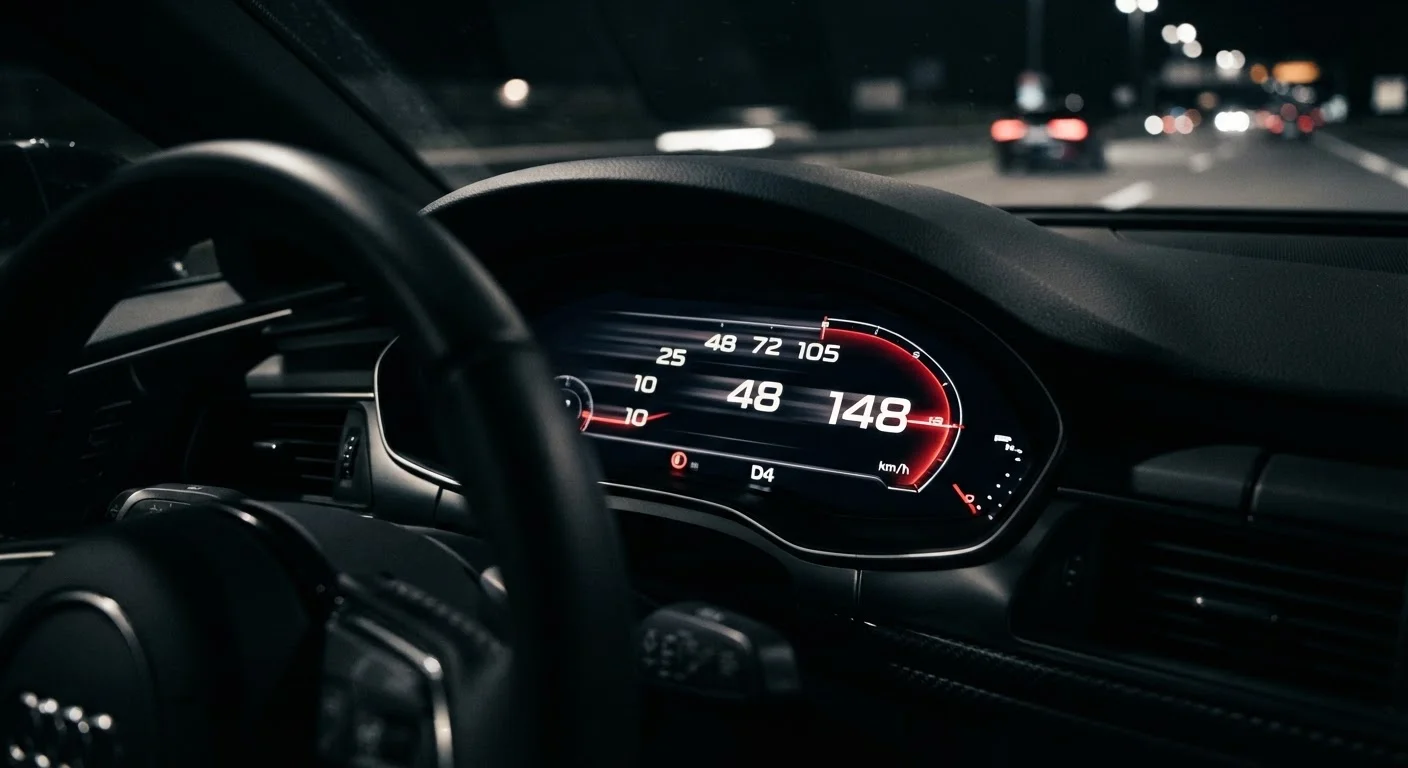
How the Number Is Produced
Every 0–100 km/h figure you read was recorded in circumstances designed to extract the best possible result. Test drivers use a flat, sealed surface — often a private airstrip or test track — with controlled ambient temperature, warmed tyres, and minimal vehicle weight. Where a launch control system is available, it's activated. The transmission is pre-staged to deliver the sharpest possible getaway.
The result is a number that reflects genuine engineering capability. It tells you what the powertrain can do when given every advantage. What it cannot do is tell you what the car will feel like when you merge onto a highway with the air conditioning on, four passengers aboard, and a half-tank of fuel.
As you dig deeper into performance specs, decoding a full performance spec sheet helps you place the 0–100 figure alongside metrics that provide better context.
What the Figure Genuinely Tells You
Despite its limitations, the 0–100 time is not meaningless. It does serve as a reliable relative comparison across similarly tested vehicles. A car that records 5.8 seconds almost certainly has a more potent powertrain than one recording 9.2 seconds, assuming both figures come from credible sources under comparable conditions.
The number also reflects how well the manufacturer has integrated the engine, gearbox, and drivetrain into a coherent system. A well-tuned automatic transmission, a sticky limited-slip differential, and precise launch control calibration all contribute to a strong time — and those same engineering choices tend to improve real-world responsiveness too.
~0.5s
Perceptible acceleration difference threshold
Automotive engineering research suggests most drivers cannot reliably perceive acceleration differences of less than half a second in everyday driving conditions.
60–100 km/h
Most common real-world passing range
Highway overtaking and merging typically occur in this speed window — a range the standard 0–100 figure does not directly measure.
Up to 15%
Real-world vs. test performance gap
Independent testing across various publications has observed 0–100 times in normal driving conditions running up to 15% slower than manufacturer-stated figures.
Power-to-weight ratio is a useful companion figure to the 0–100 time. Kerb weight and power-to-weight ratio explain why two cars with the same acceleration time can feel completely different in corners or when loaded with luggage.
What the Figure Leaves Out
The most significant blind spot is mid-range acceleration — how a car responds when you're already moving at 60 km/h and need to overtake. This 60–100 km/h or 80–120 km/h window is far more representative of real driving than a standing start, yet it rarely appears on spec sheets. A turbocharged engine with modest low-rpm torque might post a quick 0–100 time but feel sluggish during that crucial highway pass.
Transmission behaviour is another gap. A dual-clutch gearbox in sport mode during a timed run behaves very differently from the same box in comfort mode on a normal commute. The 0–100 figure captures the former; you'll mostly experience the latter.
Heat management matters too. Many petrol and hybrid powertrains produce their best 0–100 time on the first run, with performance softening as drivetrain temperatures rise. EVs are generally more consistent across repeated runs, which is one reason their acceleration figures tend to be more reproducible in practice.
For a broader view of which metrics actually reflect ownership experience, see which performance specs are worth prioritising. The parallel with fuel economy ratings is also worth considering: fuel economy figures carry similar real-world caveats.
How to Use the Number When Comparing Cars
Treat the 0–100 time as a starting point, not a verdict. If two vehicles you're comparing are within half a second of each other, the difference will be imperceptible in normal driving — focus instead on torque delivery, gear change quality, and how the throttle responds at everyday speeds.
Independent road test impressions matter here. A reviewer describing a car as feeling "hesitant off the line" or "deceptively quick in traffic" tells you more about real ownership than the spec sheet number alone. Reading EV reviews critically applies the same principle to electric vehicle performance claims.
Finally, consider what the figure doesn't cover at all: braking. Quick acceleration means little if stopping distances are long. Understanding stopping distances rounds out the picture of how a car actually performs when it matters most.
Ask for a rolling-start test drive
When evaluating a car's real-world performance, ask the dealer if you can spend time on a highway on-ramp or at freeway speeds. Accelerating from 60 to 100 km/h in normal drive mode gives you a far more accurate feel for day-to-day responsiveness than a standing-start sprint ever will.